4 Population genetics indices
In this chapter, we will see how to compute some population genetics indices in STRAF.
4.1 Computing population genetics parameters in STRAF
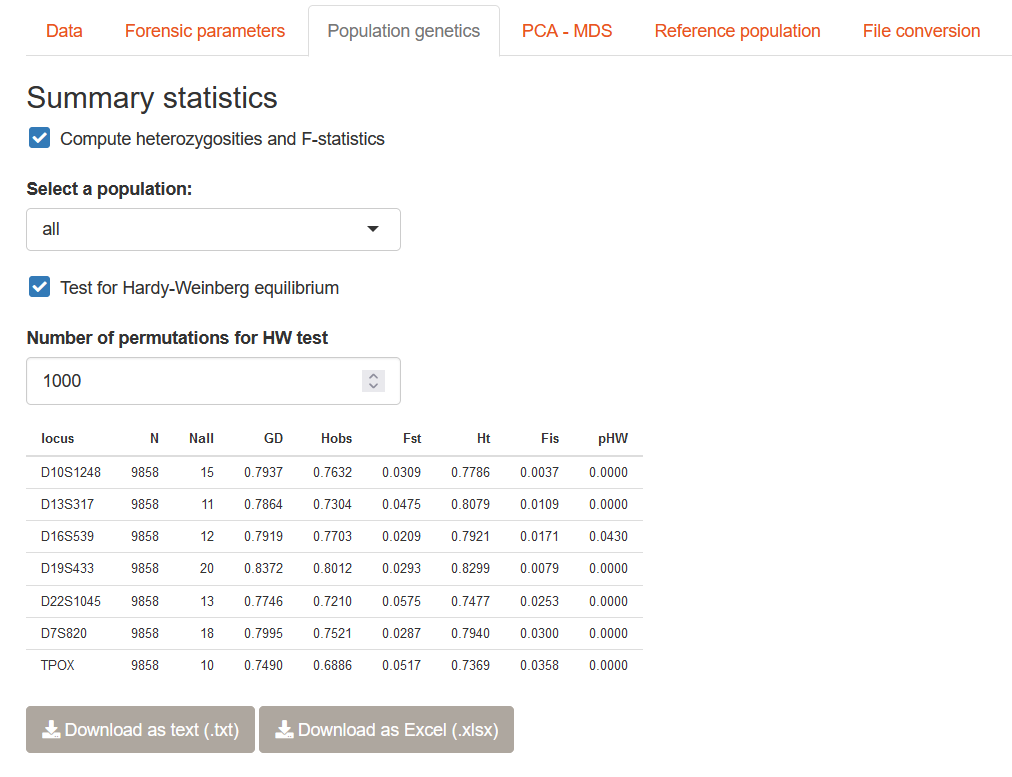
Once you have uploaded your genotypes in STRAF, you can go to the Population genetics tab to compute relevant population genetics indices. It is also possible to perform a Hardy-Weinberg equilibrium test by checking the relevant box.
4.2 Details on population genetics indices
4.2.1 Hardy-Weinberg equilibrium
A population is considered at Hardy-Weinberg equilibrium (HWE) when the observed genotypic frequencies are in agreement with the expectations in an “ideal” population, which assumes for example random mating in the population. This is important as the assumptions of the Hardy-Weinberg model allow to derive quantities such as forensic parameters and population genetic indices. Therefore, if some assumptions of the model are violated, conclusions drawn from metrics computed assuming HWE could be challenged.
If a locus presents a significant deviation from HWE, it means that a process is influencing the distribution of allele and genotype frequencies in the population. It could for example be due to inbreeding, hidden population structure, or natural selection.
STRAF reports the p-value of a test for HWE. A low p-value indicates a significant deviation from HWE.
4.2.2 Heterozygosities
In STRAF, several measures of heterozygosity are computed. They capture different aspects of genetic diversity.
The expected heterozygosity (or Gene diversity, \(H_{exp}\) or \(GD\)) has been defined in the previous chapter.
The observed heterozygosity (\(H_{obs}\)) is the proportion of heterozygous genotypes at this locus in the population.
The total heterozygosity (\(H_T\)) is the heterozygosity expected if all the individuals in all the subpopulations were behaving as a population at HWE.
4.2.3 F-statistics
STRAF reports two F-statistics.
The \(F_{\textrm{IS}}\) is a measure of genetic relatedness within a population. It is sometimes called the inbreeding coefficient. High values indicate a high degree of inbreeding.
The \(F_{\textrm{ST}}\) is a measure of genetic differentiation between populations. It takes values between 0 (no differentiation) and 1 (full differentiation).
One concept, multiple estimators.
Several estimators of \(F_{\textrm{ST}}\) exist (for example, Weir and Cockerham’s, Nei’s, Hudson’s \(F_{\textrm{ST}}\)). It’s like if each population geneticist had decided to develop their own estimator!
Why is that? In statistics, what we call an estimator is a metric aiming at estimating a given quantity based on observed data. It is important to keep in mind that these estimators rely on a specific model, with underlying assumptions. It explains why some estimators are more or less reliable depending on the case and observed data, and each of them has been developed for a different situation. In the case of \(F_{\textrm{ST}}\) for example, different estimators assume different demographic models.
4.3 Linkage disequilibrium (LD)
4.3.1 What is linkage disequilibrium?
Linkage disequilibrium is an important quantity to be measured in genetics. It is defined as the nonindependence of genotypes at distinct loci. It means that it is more likely to observe the co-occurrence of some genotypes at different loci. This can be influenced by population history.
However, most of the times, LD is explained by the physical proximity between loci. If two loci are next to each other on the genome, recombination events between them will be rare and genotypes won’t be shuffled. Genotypes at these loci will be correlated and linkage disequilibrium will be high. On the other hand, two loci found on two different chromosomes are not expected to show any LD signals as genotypes will be systematically shuffled at each generation.
4.3.2 How to compute LD in STRAF?
It is possible to test for the presence of LD in the dataset you uploaded using STRAF. After checking the Display pairwise LD p-values matrix, LD tests between each pair of loci will be performed and p-values will be reported.
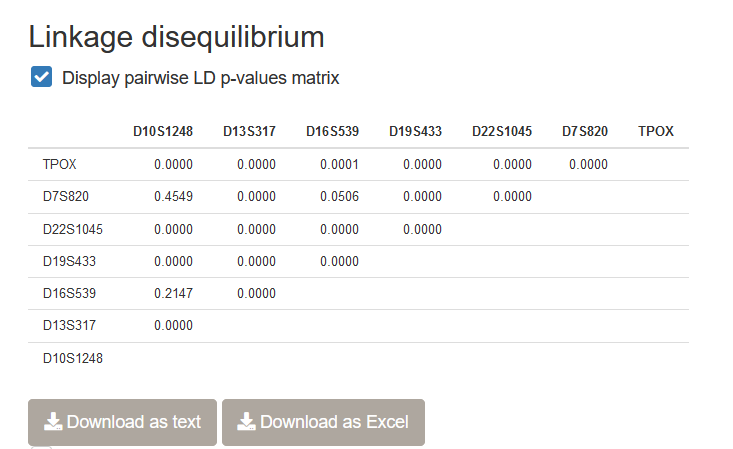
Important note: Other population genetics software, Genepop and Arlequin, implement more reliable versions of the LD test that should be preferred. They are currently not implemented in STRAF because of performance limitations. If you need to perform such a test, the File conversion utilities (cf. Chapter 6) should facilitate the workflow.