5 Multivariate statistics
In this chapter, we will describe the two multivariate statistics methods implemented in STRAF, Principal Component Analysis (PCA) and Multidimensional Scaling (MDS).
5.1 Principal Component Analysis (PCA)
PCA is a method of dimensionality reduction. The principle is that it tries to capture most of the variation present in the data and project it onto a small number of new axes called principal components (PCs).
This is a useful method to capture variation from a large number of variables and allows to discover hidden patterns by increasing interpretability.
In our case, if we consider that each allele at each locus is a variable, and that our individual observations are the presence / absence of each allele for each sample, we end up with a highly dimensional dataset (we have as many variables as we have alleles!). It gets even worse if you analyse genome sequences, where you can have millions of variables in your dataset. This is definitely not an interpretable dataset if you are not able to easily extract relevant information.
PCA allows to bring most of the variation existing between our samples onto a few axes capturing most of the variation (PCs).
In STRAF, you can perform a PCA by going into the PCA - MDS tab and checking the following Run and plot a PCA checkbox.
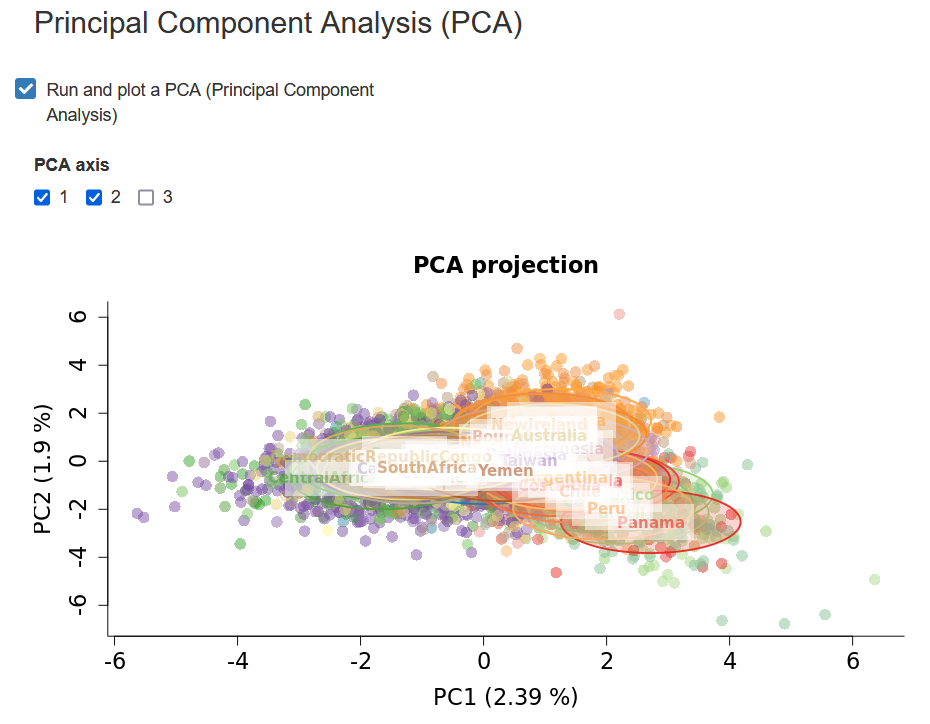
It will trigger the PCA computation and return a graph. You are also able to download the coordinates of the samples on different PCs (also called eigenvectors).
Interpreting PCA results
PCA has become a popular tool in population genetics, as the relationships between individuals on the PCA projection tend to reflect their genetic relatedness. The closer individuals are on the PCA projection, the more genetically related they tend to be.
It can also be used as a quality control tool. For example, if a sample is very far from all the others, including the ones that are part of the same population, it is possible that there is an issue with the data. One would need to inspect the raw data and check if any strange pattern can be found.
Also, PCA with haploid markers can typically reveal clustering according to haplogroups.
It is important to be aware of the influence of non-demographic processes on the PCA projection. For example, imbalanced sample sizes between populations can drive some patterns. When populations are sampled unevenly, the projection will be distorted and distances observed on the projection can be driven by these differences and not by their evolutionary history.
Hence, as multiple processes influence the results, PCA should remain an exploratory approach and further analyses should be conducted before drawing any major conclusions on the relationships between populations and individuals.
5.2 Multidimensional Scaling (MDS)
An MDS is conceptually similar to a PCA. One of the main differences is that it requires input data to be in a different format. As PCA uses raw genotypes and can accommodate data at the individual level, pairwise distances between data points are used for an MDS.
In forensics, it is typically used to compare populations and not individuals, even though it would be theoretically possible.
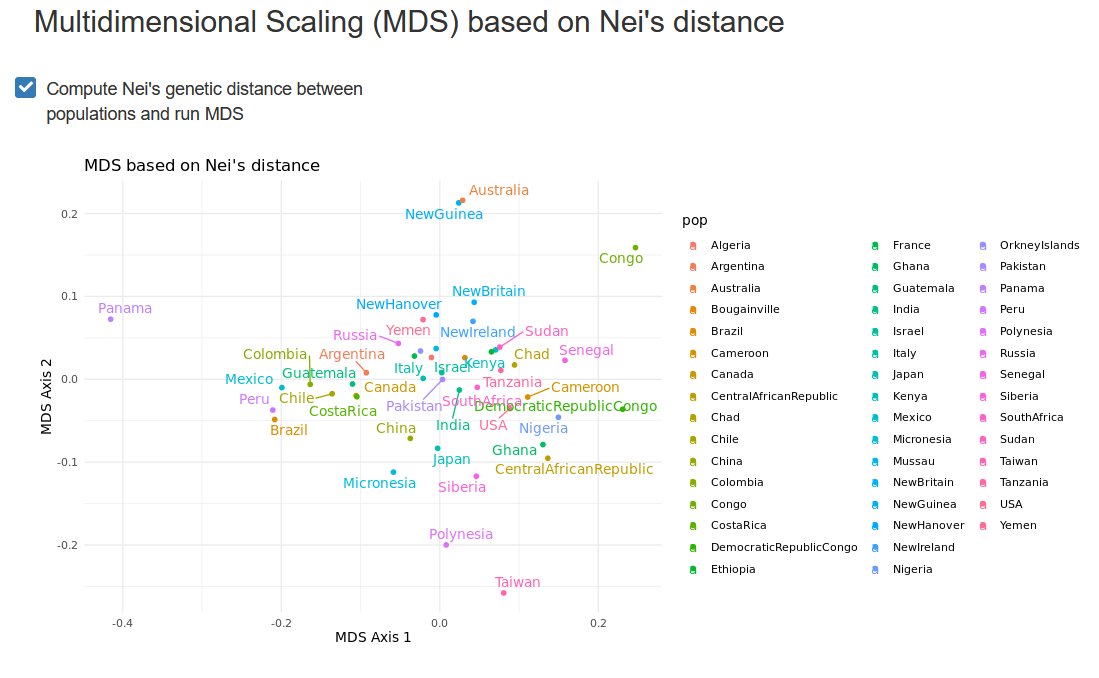
As pairwise distances between populations are used, and MDS can be based on any genetic distance: one could for example compute pairwise FSTs, Nei’s genetic distance, or any other metric.
Based on these distances, the MDS will project the populations onto a lower-dimensional space. This projection facilitates the interpretation of relationships between populations.
Interpreting MDS results
Just like with a PCA, the closer populations are on the MDS projection, the more genetically related they tend to be, based on the markers that have been used to compute their pairwise genetic distances.
In forensics, the MDS is often used as a confirmation that the population sample clusters with the expected populations, e.g. a sample from Switzerland with other western European populations.
Again, like for the PCA, the MDS should remain an exploratory approach and further analyses should be conducted before drawing any major conclusions on the relationships between populations and individuals.